Heart Rate Variability analysis methodology
|
 |
Short-term HRV analysis requires much
shorter recordings - typically 5-min long. However such recordings are
assumed to be done at steady-state physiological condition and should
be properly standardized to produce comparable data. Typically such
measurements should be done in either supine or comfortably sitting
relaxed position, limiting body movements, conversations, any mental
activities.
According to the standards set forth by
the Task Force of the European Society of Cardiology and North American
Society of Pacing and Electrophysiology in 1996, there are two methods
of analysis of HRV data:
time-domain and
frequency-domain analysis. In either
method, the interbeat intervals should be properly calculated and any
abnormal heartbeats found.
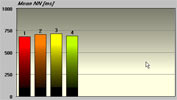
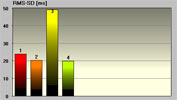
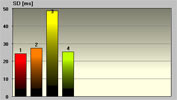
Time-domain measures are the simplest
parameters to be calculated. Before such calculation all abnormal
heartbeats and artifacts must be removed from consideration. The
following time-domain parameters can be calculated for both long-term
and short-term recordings: Mean HR, SDNN and RMS-SD. Some extra
parameters can be calculated specifically for long-term recordings. The
time-domain parameters are associated mostly with overall variability
of HR over the time of recording, except RMS-SD, which is associated
with fast (parasympathetic) variability.
The example screenshots above were taken from
Heart
Rhythm Scanner which is the one of the
Heart Rate
Variability Systems available on the market today.
Frequency-domain measures pertain to HR
variability at certain frequency ranges associated with specific
physiological processes. Before frequency-domain analysis is performed,
all abnormal heartbeats and artifacts must be detected and removed,
then cardiotachogram (sequence of RR intervals) must be re-sampled to
make it as if it is a regularly sampled signal. A standard spectral
analysis routine is applied to such modified recording and the
following parameters evaluated on 5-min time interval: Total Power
(TP), High Frequency (HF), Low Frequency (LF) and Very Low Frequency
(VLF). When long-term data is evaluated an additional frequency band is
derived - Ultra Low Frequency.
 |
 |
The HF power spectrum is evaluated in
the range from 0.15 to 0.4 Hz. This band reflects parasympathetic
(vagal) tone and fluctuations caused by spontaneous respiration known
as respiratory sinus arrhythmia.
The LF power spectrum is evaluated in
the range from 0.04 to 0.15 Hz. This band can reflect both sympathetic
and parasympathetic tone.
The VLF power spectrum is evaluated in
the range from 0.0033 to 0.04 Hz. The physiological meaning of this
band is most disputable. With longer recordings it is considered
representing sympathetic tone as well as slower humoral and
thermoregulatory effects. There are some findings that in shorter
recordings VLF has fair representation of various negative emotions,
worries, rumination etc.
The TP is a net effect of all possible
physiological mechanisms contributing in HR variability that can be
detected in 5-min recordings, however sympathetic tone is considered as
a primary contributor.
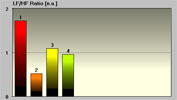
The LF/HF Ratio is used to indicate
balance between sympathetic and parasympathetic tone. A decrease in
this score might indicate either increase in parasympathetic or
decrease in sympathetic tone. It must be considered together with
absolute values of both LF and HF to determine what factor contributes
in autonomic disbalance.
The frequency domain analysis is
traditionally performed by means of Fast Fourier Transformation (FFT).
This method is simple in calculation but for fair representation of all
frequency-domain HRV scores at least 5-min data should be collected.
FFT assumes that time series represents a steady-state process. Because
of that all data recordings should be conducted at highly stable
standardized conditions, when no other factors other than current
autonomic tone contributes in HRV. One of the most serious
disadvantages of that is its insensitivity to rapid transitory
processes, which often possess very valuable information about how
physiology or certain pathological processes behave dynamically.
Some most recent studies implemented an
alternative way to estimate power spectrum of HRV. It is based on
auto-regression methods. One of its major advantages is that it doesn't
require to have analyzed data series to be in steady state. Thus any
HRV data can be analyzed and fair HRV information still derived. Such
analysis can be also performed on relatively shorter time intervals
(less than 5 minutes) without missing meaningful HRV information.
Finally this method is sensitive to rapid changes in HR properly
showing tiny changes in autonomic balance. The drawback of this
approach is a necessity to perform massive calculations to find best
order of auto-regression model.
Normative Data Sets
From clinical
perspective it is important not only to evaluate all HRV scores but be
able to assess such HRV data, whether they are normal or not and how to
interpret such data. It is known that HRV scores are age-dependent.
Most of scores decrease with age. For better HRV data assessment
special sets of reference ranges for each HRV parameter were
created. Such ranges are based on statistics derived from HR data
measured in a number of healthy individuals of different ages under
standardized conditions. Such norms are considered as a reference point
and cannot be used for any diagnostic purpose.
|